What is a Spinning Top Pattern?
Similar to a Doji, a Spinning Top is symmetrical with upper and lower wicks of approximately equal length. The bulls sent the price higher and the bears sent the price lower, but in the end the price closed near where it opened.
What Does the Spinning Top Signal?
The Spinning Top represents clear indecision in the market, the bulls and bears are fighting for control over the market and during the trading period there were no clear winners. If the Spinning Top forms in an uptrend or downtrend, this is normally seen as significant, as it is a signal that the buyers are losing momentum when found in an uptrend and in a downtrend it is a signal that the sellers are losing momentum.
The creation of the Spinning Top pattern illustrates why the Spinning Top represents such indecision. After the open, bulls push prices higher only for them to be rejected by bears and pushed lower. Bears are unable to keep prices lower and bulls push back to the opening price of the candle going into the close.
Trading a Spinning Top Pattern
Depending on the formation of previous trends, hammer patterns can often actually be hanging man patterns or shooting stars. Typically, hanging man patterns come after a wave of buying and tend to be bearish indicators. But, hammers form after an aggressive selling wave. Hammers can also sometimes be confused with Doji candlesticks. Doji actually indicates indecision since it contains both upper and lower shadows.
Traders could look for hammers to pull back towards a significant support level on the chart. When this occurs in isolation, with no support to the left, traders prefer not acting upon it. In these cases, traders may wait for a daily close to see if a price reversal takes place.
Technical Analysts also suggest that the pattern becomes more reliable when it is greater than the trading range of prior candles over the period of the last couple of days. Volume is also an important factor to consider. If trade volume has increased from the prior session, it could indicate rising interest in the asset, at the current price level.

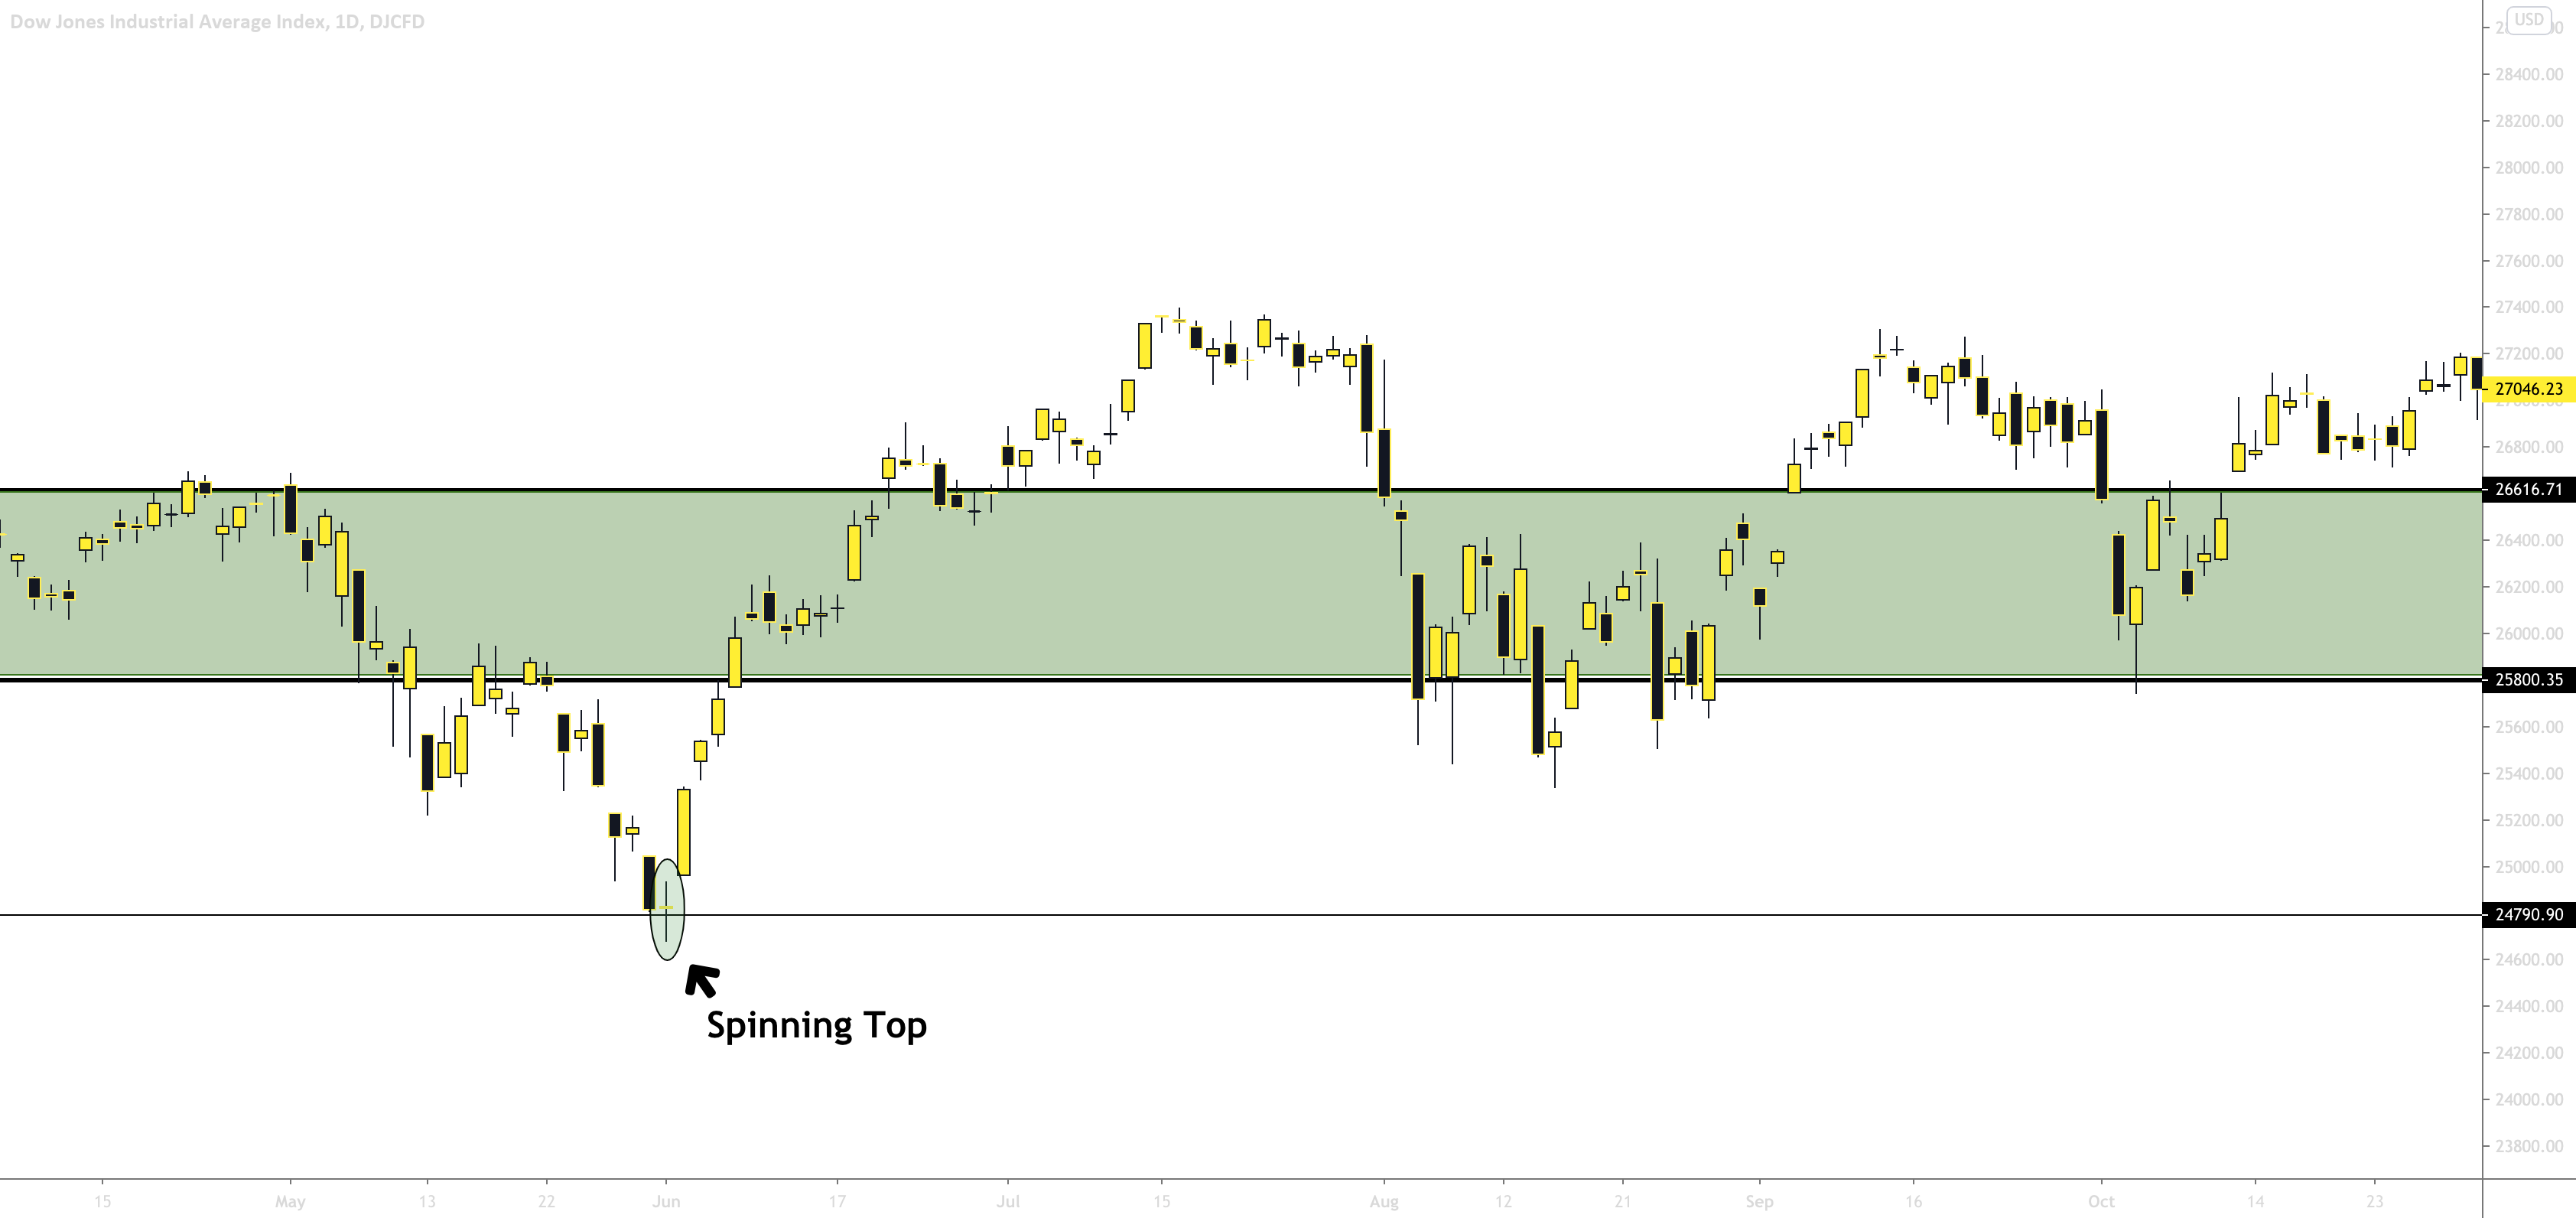
Looking at the 1D time frame of DJI (Dow Jones Industrial Average Index) we see a spinning top at the bottom of the downtrend to a reversal upwards. This move bounced off of the $24,790 support level all the way up to $27,400 before getting rejected back down to a higher low. This candlestick pattern clearly indicated a reversal in the market.

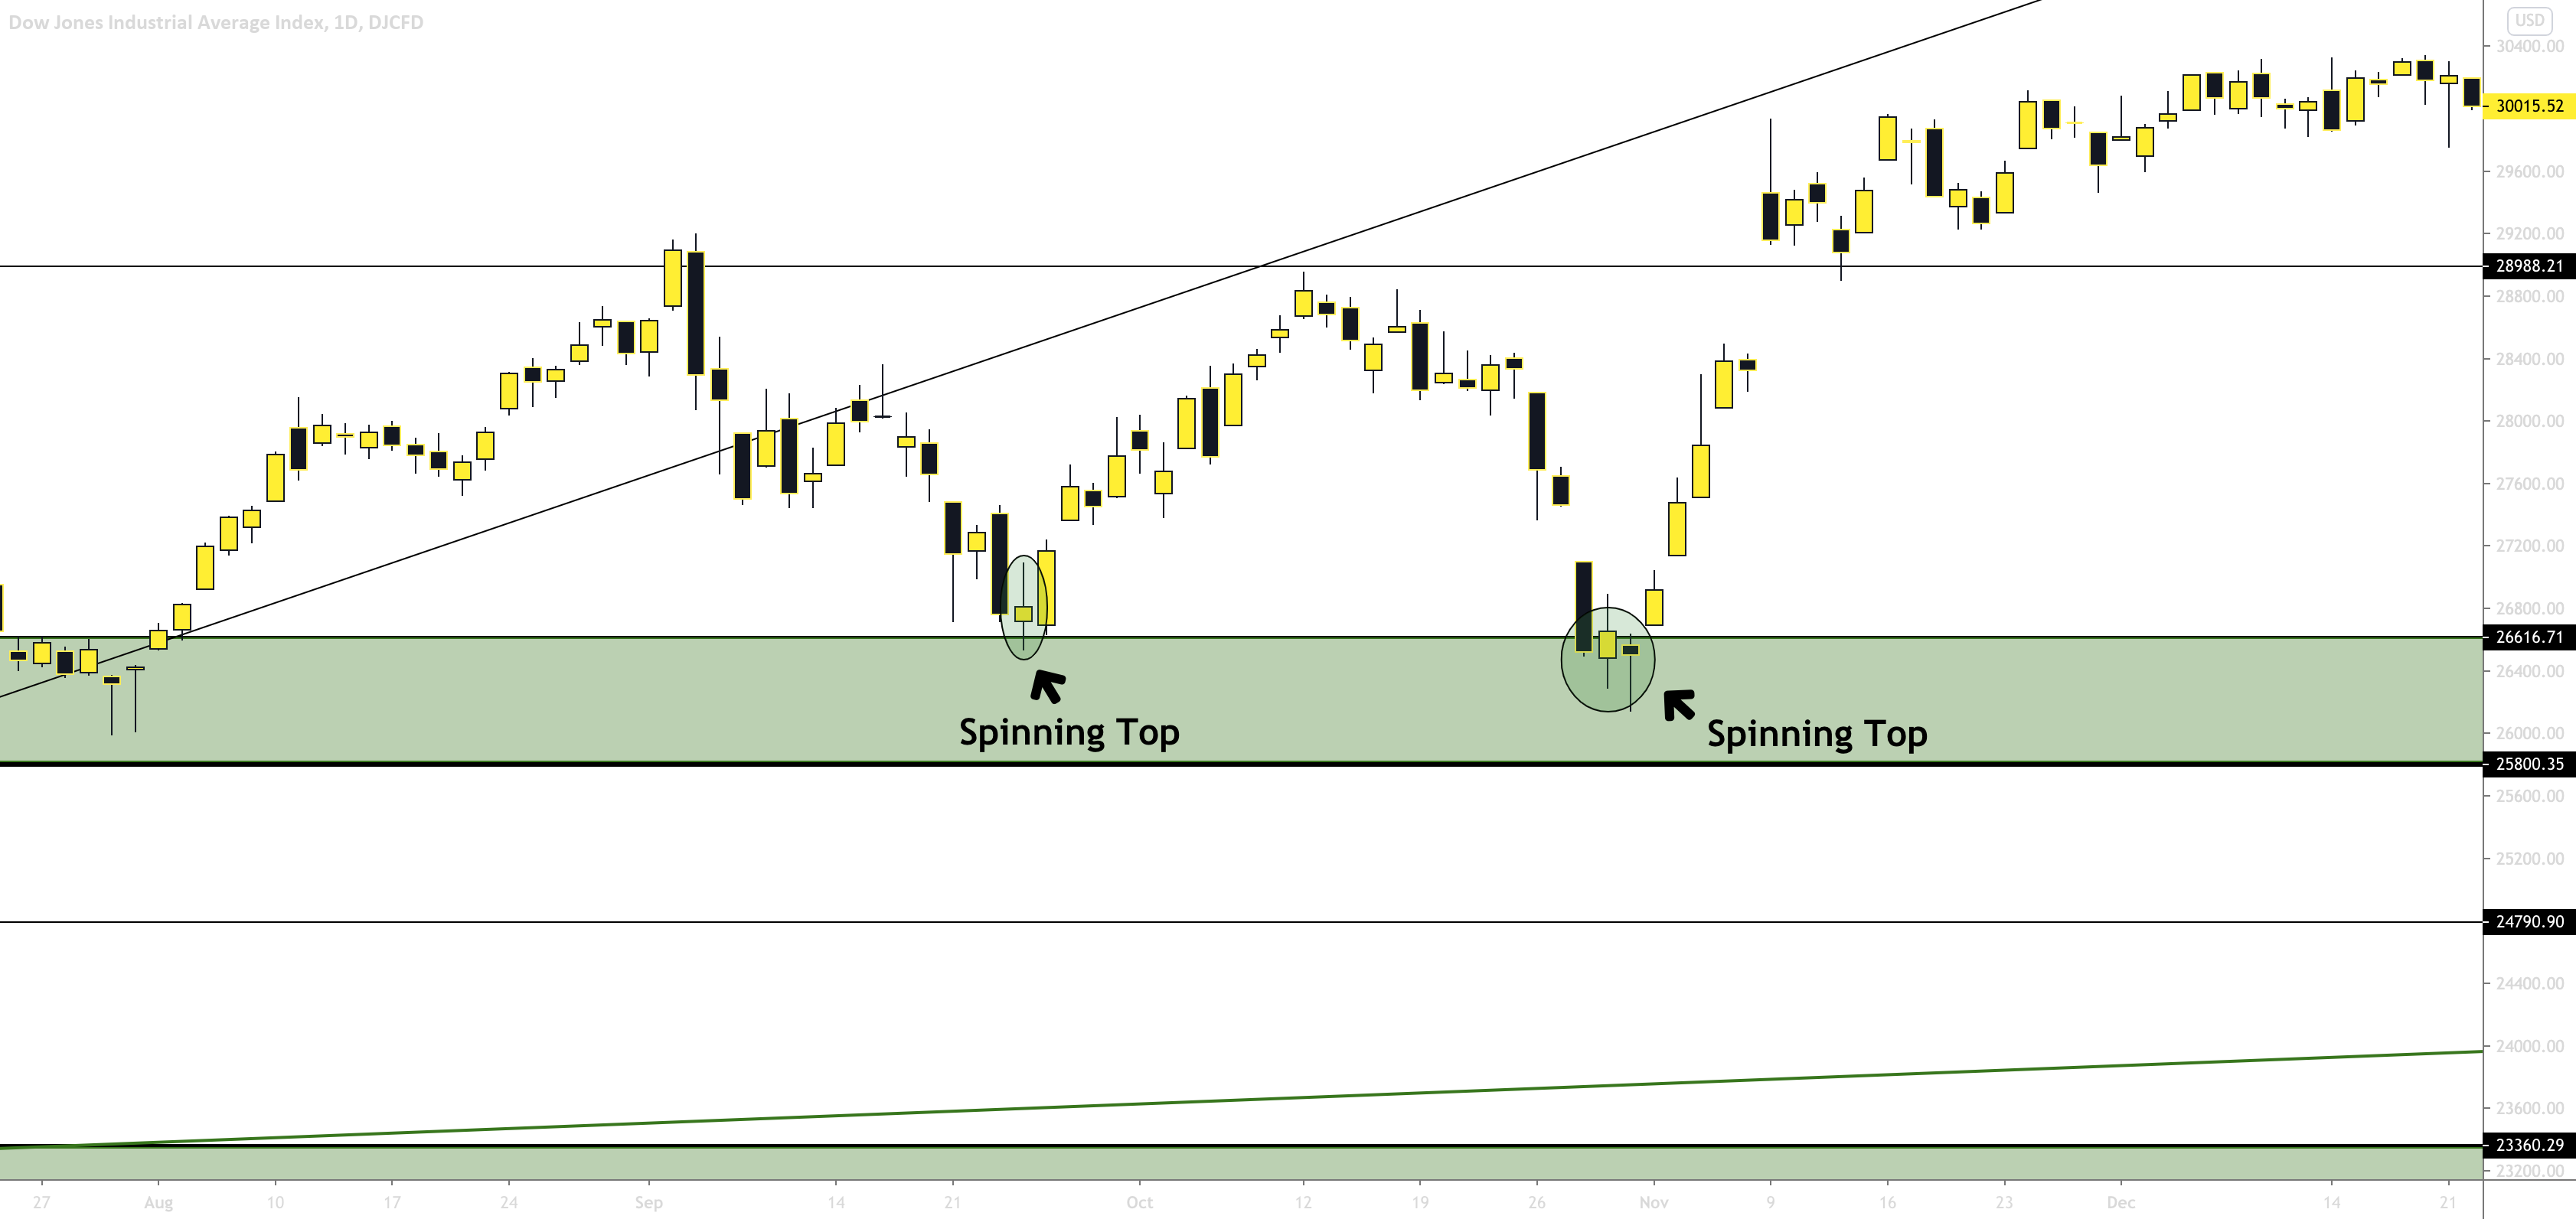
Looking at the 1D time frame of DJI (Dow Jones Industrial Average Index) we see a spinning top at the bottom of the downtrend twice, indicating that the bulls are starting to take over. This pattern would also be considered a double bottom as the primary candlestick pattern, with the individual pattern being the spinning top. The 1st spinning top found along the $26,616 support bounced the price up to $28,988, which indicated a bullish reversal. The 2nd spinning top bounced off the same $26,616, indicating a bullish reversal and pumped to close above the $29,888 resistance and beyond $30,000+.
Similarities Between the Spinning Top and the Doji
A major similarity between a Doji and Spinning Top pattern is that these patterns are both commonly seen as part of larger patterns, such as star formations. Both the Doji and Spinning Top represent neutrality in the market and that the buying and selling pressures are neutral, equal in price from the candle open to candle close. They both also represent that the trend is losing momentum and coming to an end for a potential reversal, whether it be bullish or bearish.
Differences Between the Spinning Top and the Doji
The difference between a Doji and Spinning Top pattern is that although spinning tops are similar to Dojis, their bodies are much larger, even though the open and close are very close. A candle’s body can represent up to 5% of the size of the entire candle in order to be classified as a Doji, otherwise it becomes a spinning top.
Limitations of the Spinning Top Pattern
Spinning Top patterns just like any other pattern comes with its set of limitations. Spinning Top patterns are very commonly found on candlestick charts so you have to be cautious of the Spinning Tops that don’t carry any hidden meanings. If a Spinning Top is spotted on a smaller time frame such as a minute or hourly, it doesn’t hold as much meaning compared to spotting a Spinning Top on a larger time frame such as a daily or weekly. Larger time frames give the Spinning Top a lot more strength and meaning, especially when seen at the top or bottom of a trend, indicating a reversal in the markets.


